
学習環境
- Surface 3 (4G LTE)、Surface 3 タイプ カバー、Surface ペン(端末)
- Windows 10 Pro (OS)
- 数式入力ソフト(TeX, MathML): MathType
- MathML対応ブラウザ: Firefox、Safari
- MathML非対応ブラウザ(Internet Explorer, Microsoft Edge, Google Chrome...)用JavaScript Library: MathJax
- 参考書籍
ラング線形代数学(上)(S.ラング (著)、芹沢 正三 (翻訳)、ちくま学芸文庫)の1章(R^n におけるベクトル)、5(直線と平面)、練習問題7.を取り組んでみる。
コード(Emacs)
Python 3
#!/usr/bin/env python3
# -*- coding: utf-8 -*-

from sympy import pprint, symbols, Matrix, solve, plot

print('5.')
A = Matrix([3, -5])
B = Matrix([2, 3])
for t in [A.T, B.T, A.dot(B)]:
    pprint(t)
    print()

x, y = symbols('x y')
eq1 = 3 * x - 5 * y - 1
eq2 = 2 * x + 3 * y - 5
p = plot(*[solve(eq, y)[0] for eq in [eq1, eq2]], show=True, legend=True)
for i, color in enumerate(['red', 'blue']):
    p[i].line_color = color
# p.save('sample5.svg')

print('6.')
a = [((3, -5), (2, 1)),
     ((2, 7), (1, -1)),
     ((3, -5), (5, 3)),
     ((-1, 1), (1, 1))]
for i, (A, B) in enumerate(a):
    print(f'({chr(ord("a") + i)})')
    AM = Matrix(A)
    BM = Matrix(B)
    for t in [AM.T, BM.T, AM.dot(BM)]:
        pprint(t)
        print()
    if AM.dot(BM) == 0:
        print('垂直である。')
    else:
        print('垂直ではない。')
    print()

pairs = [(3 * x - 5 - 1, 2 * x + y - 2),
         (2 * x + 7 * y - 1, x - y - 5),
         (3 * x - 5 * y - 1, 5 * x + 3 * y - 7),
         (- x + y - 2, x + y - 9)]

for i, (eq1, eq2) in enumerate(pairs):
    c = '({chr(ord("a") + i)})'
    print(c)
    for t in [eq1, eq2]:
        pprint(t)
    p = plot(*[solve(eq, y)[0] for eq in [eq1, eq2]], show=False, legend=True)
    for i, color in enumerate(['red', 'blue']):
        p[i].line_color = color
    p.save(f'sample6_{c}.svg')
入出力結果(Terminal, Jupyter(IPython))
$ ./sample7.py
7.
(a)
x - y + 3⋅z + 1
(b)
-3⋅x - 2⋅y + 4⋅z + 2⋅π + 26
(c)
-x + 5⋅z - 33
$
Grapher を使ってみた。
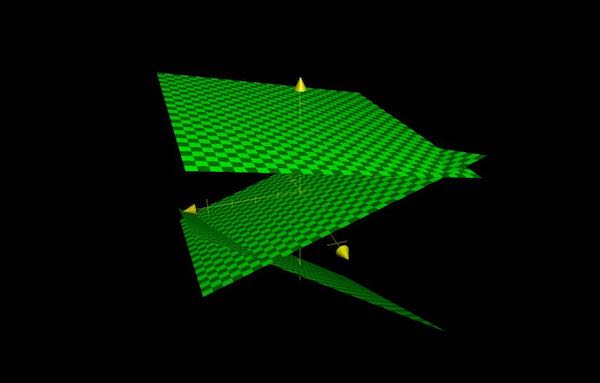
使い方をちゃんと習得すればもっと楽しくなりそう。
0 コメント:
コメントを投稿