
学習環境
- Surface 3 (4G LTE)、Surface 3 タイプ カバー、Surface ペン(端末)
- Windows 10 Pro (OS)
- 数式入力ソフト(TeX, MathML): MathType
- MathML対応ブラウザ: Firefox、Safari
- MathML非対応ブラウザ(Internet Explorer, Google Chrome...)用JavaScript Library: MathJax
- 参考書籍
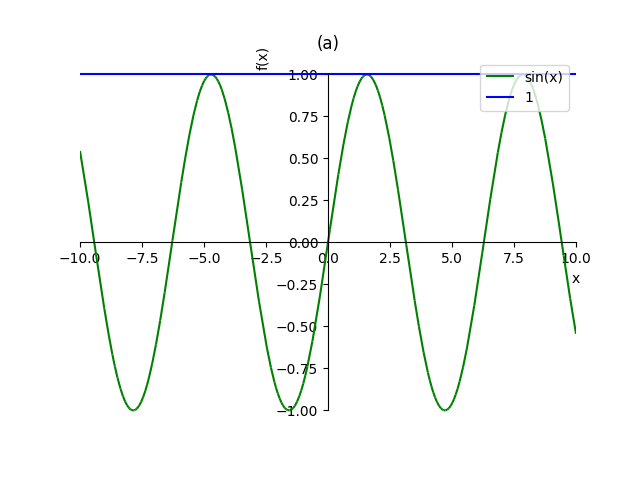
解析入門 原書第3版 (S.ラング(著)、松坂 和夫(翻訳)、片山 孝次(翻訳)、岩波書店)の第2部(微分と基本的な関数)、第4章(正弦と余弦)、4(導関数)、練習問題16.を取り組んでみる。
コード(Emacs)
Python 3
#!/usr/bin/env python3
# -*- coding: utf-8 -*-
from sympy import pprint, symbols, sin, cos, tan, pi, Derivative, plot
print('16.')
x = symbols('x')
eqs = [(sin(x), pi / 2),
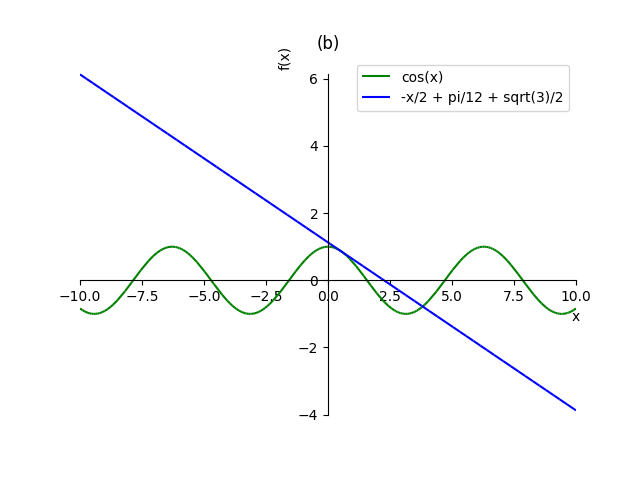
(cos(x), pi / 6),
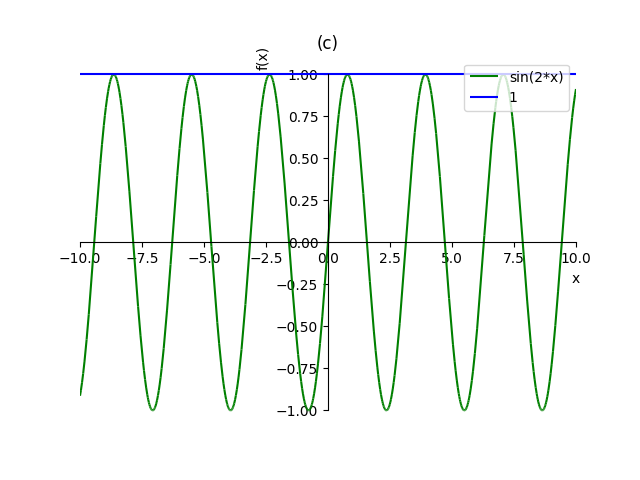
(sin(2 * x), pi / 4),
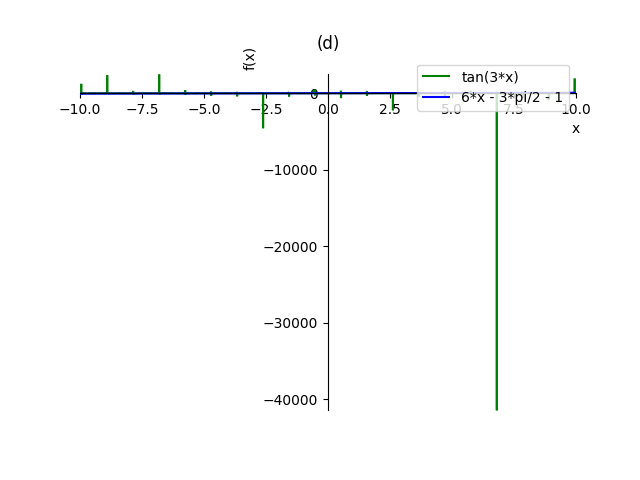
(tan(3 * x), pi / 4),
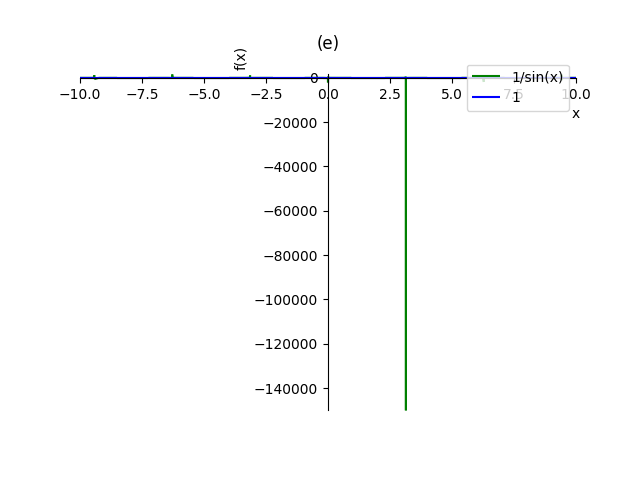
(1 / sin(x), pi / 2),
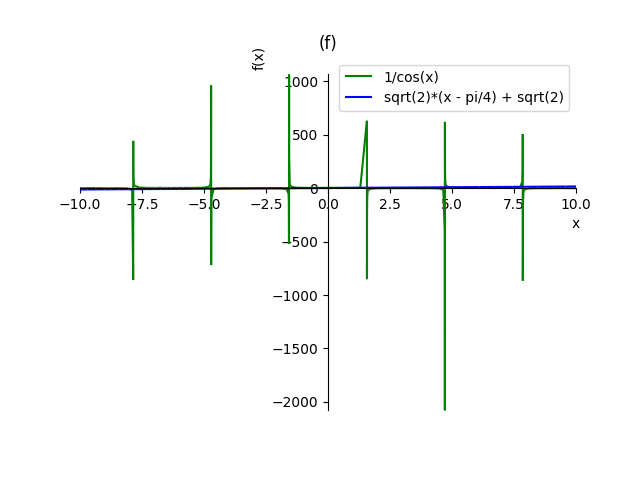
(1 / cos(x), pi / 4),
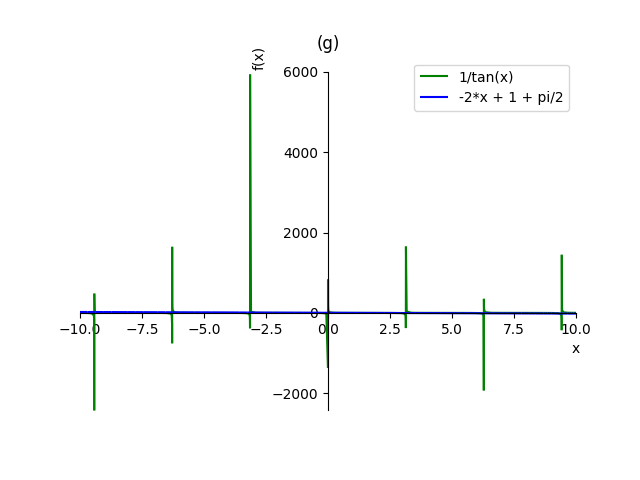
(1 / tan(x), pi / 4),
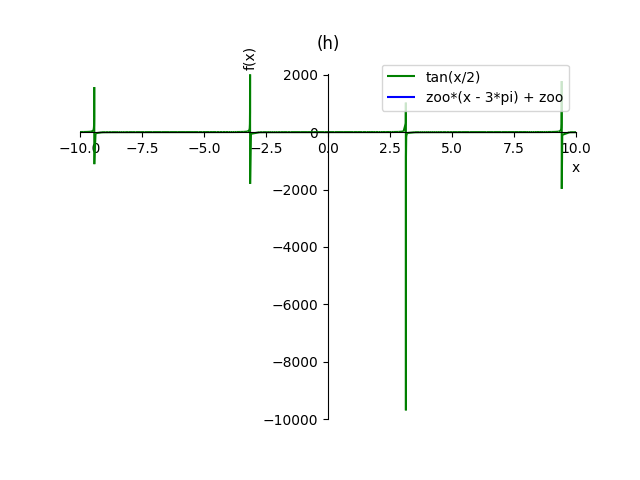
(tan(x / 2), 3 * pi),
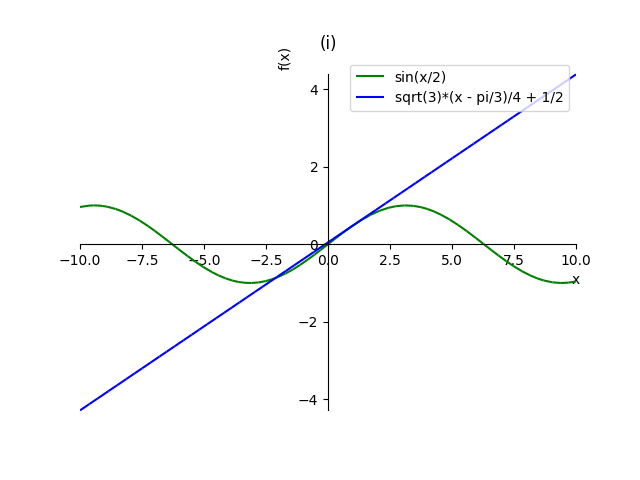
(sin(x / 2), pi / 3),
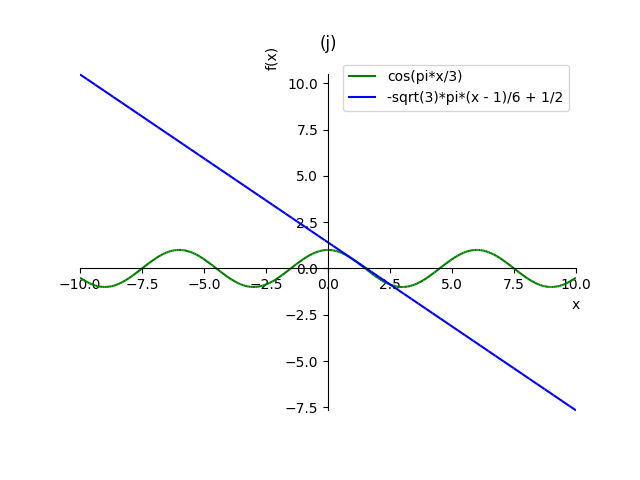
(cos(pi * x / 3), 1),
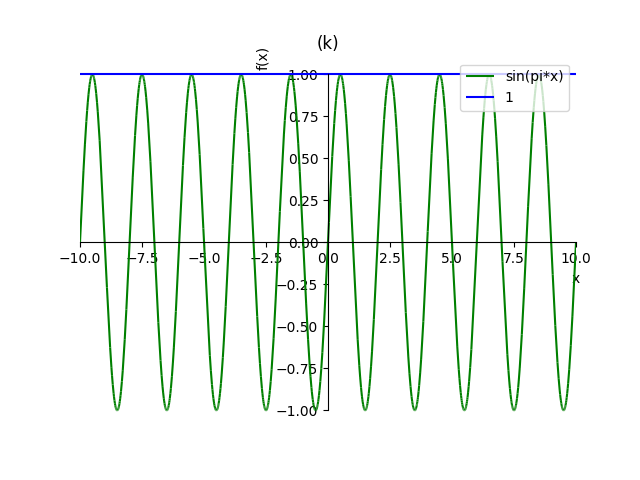
(sin(pi * x), 1 / 2),
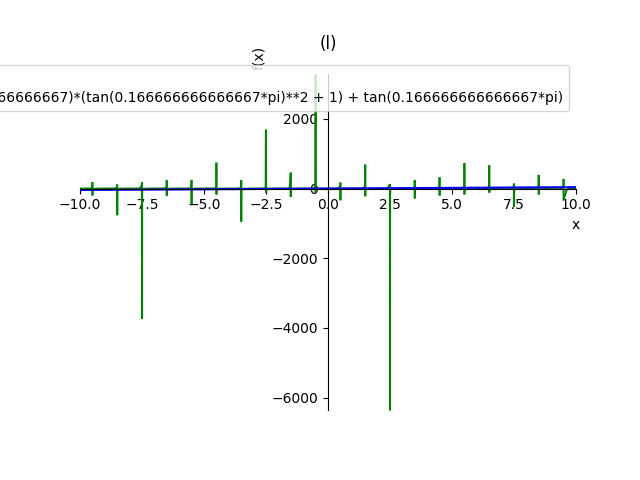
(tan(pi * x), 1 / 6)]
for i, (f, x0) in enumerate(eqs):
c = chr(ord('a') + i)
print('({0})'.format(c))
d = Derivative(f, x, 1)
f1 = d.doit()
pprint(d)
pprint(f1)
g = f1.subs({x: x0}) * (x - x0) + f.subs({x: x0})
p = plot(f, g, show=False, legend=True, title='({})'.format(c))
for i, color in enumerate(['green', 'blue']):
p[i].line_color = color
p.save('sample16{0}.png'.format(c))
print()
入出力結果(Terminal, IPython)
$ ./sample16.py
16.
(a)
d
──(sin(x))
dx
cos(x)

(b)
d
──(cos(x))
dx
-sin(x)

(c)
d
──(sin(2⋅x))
dx
2⋅cos(2⋅x)

(d)
d
──(tan(3⋅x))
dx
     2
3⋅tan (3⋅x) + 3

(e)
d ⎛  1   ⎞
──⎜──────⎟
dx⎝sin(x)⎠
-cos(x)
────────
   2
sin (x)

(f)
d ⎛  1   ⎞
──⎜──────⎟
dx⎝cos(x)⎠
 sin(x)
───────
   2
cos (x)

(g)
d ⎛  1   ⎞
──⎜──────⎟
dx⎝tan(x)⎠
     2
- tan (x) - 1
─────────────
      2
   tan (x)

(h)
d ⎛   ⎛x⎞⎞
──⎜tan⎜─⎟⎟
dx⎝   ⎝2⎠⎠
   2⎛x⎞
tan ⎜─⎟
    ⎝2⎠   1
─────── + ─
   2      2

(i)
d ⎛   ⎛x⎞⎞
──⎜sin⎜─⎟⎟
dx⎝   ⎝2⎠⎠
   ⎛x⎞
cos⎜─⎟
   ⎝2⎠
──────
  2

(j)
d ⎛   ⎛π⋅x⎞⎞
──⎜cos⎜───⎟⎟
dx⎝   ⎝ 3 ⎠⎠
      ⎛π⋅x⎞
-π⋅sin⎜───⎟
      ⎝ 3 ⎠
────────────
     3

(k)
d
──(sin(π⋅x))
dx
π⋅cos(π⋅x)

(l)
d
──(tan(π⋅x))
dx
  ⎛   2         ⎞
π⋅⎝tan (π⋅x) + 1⎠

$
HTML5
<div id="graph0"></div>
<pre id="output0"></pre>
<label for="r0">r = </label>
<input id="r0" type="number" min="0" value="0.5">
<label for="dx">dx = </label>
<input id="dx" type="number" min="0" step="0.0001" value="0.001">
<br>
<label for="x1">x1 = </label>
<input id="x1" type="number" value="-5">
<label for="x2">x2 = </label>
<input id="x2" type="number" value="5">
<br>
<label for="y1">y1 = </label>
<input id="y1" type="number" value="-5">
<label for="y2">y2 = </label>
<input id="y2" type="number" value="5">
<br>
<label for="dx0">dx0 = </label>
<input id="dx0" type="number" value="0.1">

<button id="draw0">draw</button>
<button id="clear0">clear</button>

<script type="text/javascript" src="https://cdnjs.cloudflare.com/ajax/libs/d3/4.2.6/d3.min.js" integrity="sha256-5idA201uSwHAROtCops7codXJ0vja+6wbBrZdQ6ETQc=" crossorigin="anonymous"></script>

<script src="sample16.js"></script>
JavaScript
let div0 = document.querySelector('#graph0'),
    pre0 = document.querySelector('#output0'),
    width = 600,
    height = 600,
    padding = 50,
    btn0 = document.querySelector('#draw0'),
    btn1 = document.querySelector('#clear0'),
    input_r = document.querySelector('#r0'),
    input_dx = document.querySelector('#dx'),
    input_x1 = document.querySelector('#x1'),
    input_x2 = document.querySelector('#x2'),
    input_y1 = document.querySelector('#y1'),
    input_y2 = document.querySelector('#y2'),
    input_dx0 = document.querySelector('#dx0'),
    inputs = [input_r, input_dx, input_x1, input_x2, input_y1, input_y2,
             input_dx0],
    p = (x) => pre0.textContent += x + '\n',
    range = (start, end, step=1) => {
        let res = [];
        for (let i = start; i < end; i += step) {
            res.push(i);
        }
        return res;
    };

let d = (x) => Math.tan(3 * x),
    d0 = (x) => 6 * (x - Math.PI / 4) - 1,
    e = (x) => 1 / Math.sin(x),
    e0 = (x) => 1,
    f = (x) => 1 / Math.cos(x),
    f0 = (x) => Math.sqrt(2) * (x - Math.PI / 4) + Math.sqrt(2),
    g = (x) => 1 / Math.tan(x),
    g0 = (x) => -2 * (x - Math.PI / 4) + 1,
    h = (x) => Math.tan(x / 2),
    l = (x) => Math.tan(Math.PI * x),
    l0 = (x) =>  4 * Math.PI / 3 * (x - 1 / 6) + 1 / Math.sqrt(3);

let draw = () => {
    pre0.textContent = '';

    let r = parseFloat(input_r.value),
        dx = parseFloat(input_dx.value),
        x1 = parseFloat(input_x1.value),
        x2 = parseFloat(input_x2.value),
        y1 = parseFloat(input_y1.value),
        y2 = parseFloat(input_y2.value),
        dx0 = parseFloat(input_dx0.value);

    if (r === 0 || dx === 0 || x1 > x2 || y1 > y2) {
        return;n
    }

    let points = [],
        lines = [];

    [[d, 'red'], [e, 'green'], [f, 'blue'], [g, 'brown'], [h, 'purple'],
     [l, 'skyblue']]
        .forEach((o) => {
            let [f, color] = o;
            for (let x = x1; x <= x2; x += dx) {
                let y = f(x);

                if (Math.abs(y) < Infinity) {
                    points.push([x, y, color]);
                }
            }
        });
    [[d0, 'red'], [e0, 'green'], [f0, 'blue'], [g0, 'brown'], [l0, 'skyblue']]
        .forEach((o) => {
            let [f, color] = o;

            for (let x = x1; x <= x2; x += dx0) {
                lines.push([x1, f(x1), x2, f(x2), color]);
            }
        });

    let xscale = d3.scaleLinear()
        .domain([x1, x2])
        .range([padding, width - padding]);
    let yscale = d3.scaleLinear()
        .domain([y1, y2])
        .range([height - padding, padding]);

    let xaxis = d3.axisBottom().scale(xscale);
    let yaxis = d3.axisLeft().scale(yscale);
    div0.innerHTML = '';
    let svg = d3.select('#graph0')
        .append('svg')
        .attr('width', width)
        .attr('height', height);

    svg.selectAll('line')
        .data([[x1, 0, x2, 0], [0, y1, 0, y2]].concat(lines))
        .enter()
        .append('line')
        .attr('x1', (d) => xscale(d[0]))
        .attr('y1', (d) => yscale(d[1]))
        .attr('x2', (d) => xscale(d[2]))
        .attr('y2', (d) => yscale(d[3]))
        .attr('stroke', (d) => d[4] || 'black');

    svg.selectAll('circle')
        .data(points)
        .enter()
        .append('circle')
        .attr('cx', (d) => xscale(d[0]))
        .attr('cy', (d) => yscale(d[1]))
        .attr('r', r)
        .attr('fill', (d) => d[2] || 'green');

    svg.append('g')
        .attr('transform', `translate(0, ${height - padding})`)
        .call(xaxis);

    svg.append('g')
        .attr('transform', `translate(${padding}, 0)`)
        .call(yaxis);
};

inputs.forEach((input) => input.onchange = draw);
btn0.onclick = draw;
btn1.onclick = () => pre0.textContent = '';
draw();
0 コメント:
コメントを投稿